In this post, I demonstrate how to use the Chart.js JavaScript library to create Charts on a Web App using data from Google Sheets.
How to Video:
Video Notes:
- Legacy Apps Script Editor Used in Video
- Apps Script (Script Editor) is now located under tab ‘Extensions’ instead of ‘Tools’ on Google Sheets
- Chart.js Library Click Here
- Chart.js Documentation Click Here
- JQuery Library Click Here
- For Further Details on Deploying a Web App Click Here
Code in Video:
function doGet(e) {
  return HtmlService.createHtmlOutputFromFile('WebAppChart');
}

function getCases() {
  var ss= SpreadsheetApp.getActiveSpreadsheet();
  var casesSheet = ss.getSheetByName("US COVID CASES");
  var getLastRow = casesSheet.getLastRow();

  return casesSheet.getRange(2, 1, getLastRow - 1, 2).getValues();

}

function getPopulation() {
  var ss= SpreadsheetApp.getActiveSpreadsheet();
  var populationSheet = ss.getSheetByName("CITY POPULATION");
  var getLastRow = populationSheet.getLastRow();

  return populationSheet.getRange(2, 1, getLastRow - 1, 4).getValues();

}
<!DOCTYPE html>
<html>
<head>
<base target="_top">
<script src="https://ajax.googleapis.com/ajax/libs/jquery/3.5.1/jquery.min.js"></script>
<script src="https://cdnjs.cloudflare.com/ajax/libs/Chart.js/2.9.3/Chart.js"
integrity="sha512-QEiC894KVkN9Tsoi6+mKf8HaCLJvyA6QIRzY5KrfINXYuP9NxdIkRQhGq3BZi0J4I7V5SidGM3XUQ5wFiMDuWg==" crossorigin="anonymous"></script>
<link rel="stylesheet" href="https://cdnjs.cloudflare.com/ajax/libs/Chart.js/2.9.3/Chart.css"
integrity="sha512-SUJFImtiT87gVCOXl3aGC00zfDl6ggYAw5+oheJvRJ8KBXZrr/TMISSdVJ5bBarbQDRC2pR5Kto3xTR0kpZInA==" crossorigin="anonymous" />
<script>
$( document ).ready(function() {
getCases();
getCityPopulation();
});
function getCases()
{
google.script.run.withSuccessHandler(function(ar)
{
console.log(ar);
var data = [];
var label = [];
ar.forEach(function(item, index)
{
data.push(item[1]);
label.push(item[0]);
});
var ctx = document.getElementById("lineChart").getContext("2d");
var lineChart = new Chart(ctx, {
type: 'line',
data: {
labels: label,
datasets: [{
label: 'Cases',
fill: true,
data: data,
}]
},
options: {
maintainAspectRatio: false,
elements: {
line: {
tension: 0.000001
}
},
title: {
display: true,
text: 'COVID Cases US'
},
scales: {
xAxes: [{
display: true,
}],
yAxes: [{
display: true,
}]
}
}
});
}).getCases();
};
function getCityPopulation()
{
google.script.run.withSuccessHandler(function(ar)
{
console.log(ar);
var data = [];
var label = [];
var color = [];
ar.forEach(function(item, index)
{
data.push(item[2]);
label.push(item[0]);
color.push(item[3]);
});
var ctx = document.getElementById("pieChart").getContext("2d");
var pieChart = new Chart(ctx, {
type: 'pie',
data: {
labels: label,
datasets: [{
//label: 'Cases',
//fill: false,
data: data,
backgroundColor: color,
}]
},
options: {
maintainAspectRatio: false,
title: {
display: true,
text: 'CITY POPULATION'
},
}
});
}).getPopulation();
};
</script>
</head>
<body>
<div style="width: 1000px; height: 400px;" >
<canvas id="lineChart" class="chartjs-render-monitor" ></canvas>
</div><br>
<div style="width: 400px; height: 400px;" >
<canvas id="pieChart" class="chartjs-render-monitor" ></canvas>
</div>
</body>
</html>Related Posts
 Embed Map with Marker on Google Web App - In this post, I demonstrate how to embed a map with a marker on a Web App using locations from Google Sheets. I am using the Leaflet Javascript Library.
 How to Create Date Picker on Google Web App - In this post, I demonstrate how to create a Date Picker on HTML form in a Google Web App. This helps the user to easily select the date as well as keep it in a uniform format.
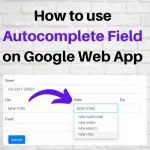 How to use Autocomplete Field on Google Web App - In this post, I demonstrate how to use the JQuery Autocomplete Field within a Bootstrap Form on Google Web App. This helps with narrowing down a list of values for easier selection on a dropdown
 JQuery Tablesorter on Google Web App - In this post, I demonstrate how to use the JQuery Tablesorter on a Google Web App. This is a good way to sort, filter and scroll through a table data.
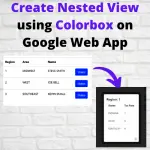 Create Nested View on Google Web App using Colorbox - In this post, I demonstrate how to create a nested view using Colorbox jQuery library on Google Web Application.